
Your neighbors are watching these housing numbers, are you?
St. Joseph County · Local Market Report · 2026
Your neighbors are watching these housing numbers.
Are you?
The St. Joseph County real estate market is doing something unexpected in 2026 — and if you're buying or selling near South Bend or Notre Dame, it's worth slowing down to actually look at the data.
Let's be honest — most housing market articles are basically the same. A chart, a vague warning about interest rates, and a CTA that says "contact me today." You've seen it a thousand times.
This one's different. I actually dug into the numbers for St. Joseph County — not just parroted national headlines — because what's happening here on the ground near South Bend and the Notre Dame corridor is genuinely interesting. Some of it is good news for buyers. Some of it is a bit of a head-scratcher. And all of it matters if you're making a move in 2026.
So grab a coffee and let's walk through it together. No jargon. No spin. Just the real picture.
📊 County-Wide Snapshot: Where Do We Stand?
Two major data sources — Redfin and Zillow — paint a picture of a market that is stable but nuanced. The headline numbers at the county level look calm. Dig one layer deeper and you'll find some real variation by neighborhood and zip code.
Two independent sources, slightly different methodologies, and both pointing in the same direction: modest, steady appreciation. That's actually a healthy sign. It tells you this market isn't inflating into bubble territory, but it also isn't stalling. (Redfin Market Data; Zillow Home Value Index, early 2026)
"Modest appreciation in a stable market isn't boring — it's exactly what long-term wealth building looks like. Slow and steady wins the equity race."
📋 Market Breakdown by Area
Here's where it gets genuinely interesting. St. Joseph County isn't one monolithic market — it's a patchwork of neighborhoods, each with its own personality and price behavior. The table below breaks down the key data points you should actually care about.
| Area / Market | Median Price | YoY Change | Avg. Days on Market | Notes |
|---|---|---|---|---|
| St. Joseph County | $220,000 | +2.2% | 42 days | Stable, steady growth countywide (Redfin) |
| St. Joseph County Alt. Value Index |
$214,316 | +3.8% | — | Zillow's methodology shows slightly higher appreciation (Zillow) |
| 46530 Granger area | $397,000 | +1.9% | 40 days | Premium zip, high demand, still moving fast (Redfin) |
| South Bend City | Varies | −8.7% | — | Price softening even as sales volume rises — worth watching (Redfin) |
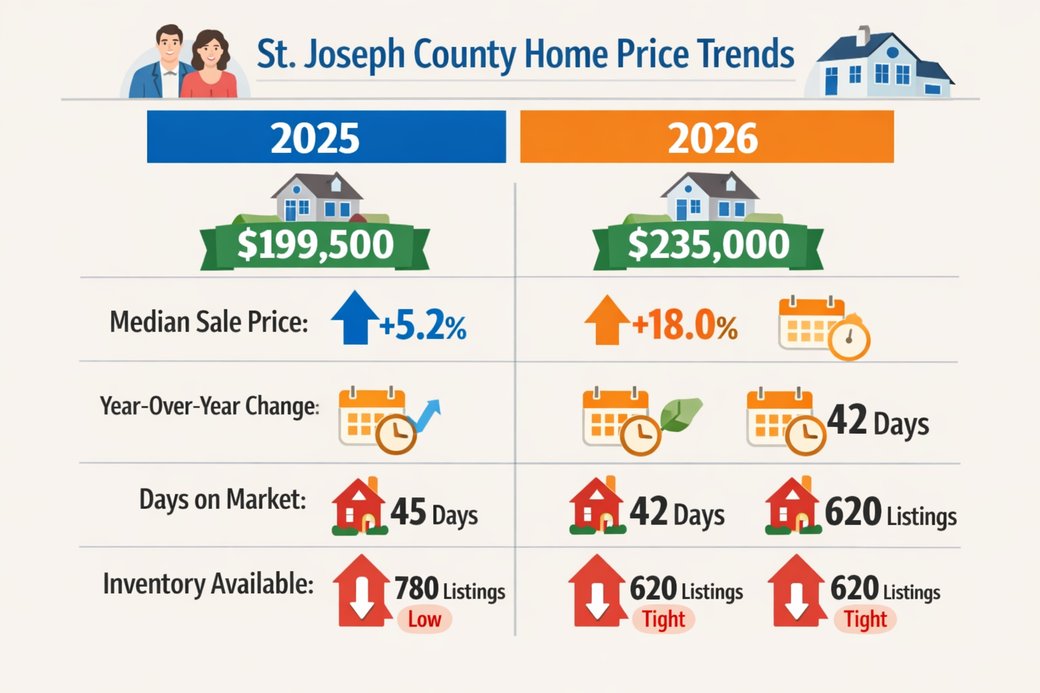
| Indiana Realtors Dec. '25 | $235,000 | +18% | — | Big YoY spike, but inventory dropped sharply (data.indianarealtors.com) |
That −8.7% figure for South Bend city proper deserves a closer look — because it comes paired with rising sales volume. That's not a distressed market; that can actually signal a correction back toward realistic pricing after a hot streak, with more buyers successfully closing deals. It's counterintuitive but not alarming. (Redfin)
🏡 The 46530 Story: Granger's Premium Market
If you're house-hunting near Notre Dame or in the Granger corridor, the 46530 zip code is its own world. Median prices around $397,000 — nearly double the county median — and homes are still selling in roughly 40 days. (Redfin)
What that tells you: demand in this pocket of St. Joseph County is real and consistent. Buyers are willing to pay a premium for the school districts, the proximity to the university, and the overall quality of life in the area. The 1.9% year-over-year appreciation is slower than it was during the post-pandemic frenzy, but that's actually healthy — it means prices aren't being bid up irrationally.
For sellers in 46530: your home is worth more than the county average would suggest. For buyers: you'll likely need to move decisively, and lowball offers probably won't fly here.
📅 Wait — 18% in One Month?
The Indiana Association of Realtors reported that the St. Joseph County December 2025 median sale price hit approximately $235,000 — an 18% jump year-over-year. Before you panic or pop champagne, context matters here.
December is always a low-volume month. When fewer homes sell, the mix of which homes sell can swing median prices dramatically. A handful of higher-end closings can inflate the median; the opposite is also true. That said, inventory was down in December, which does create upward price pressure. It's worth watching in Q1 2026 to see if the trend holds. (data.indianarealtors.com)
🔍 What This Actually Means for You
Data without context is just noise. Here's the plain-language read on what these numbers mean if you're thinking about buying or selling in St. Joseph County this year.
✔ Good News for Buyers
- County-wide prices are rising modestly — you're not chasing a runaway market like you would in Indianapolis or Chicago suburbs.
- Days on market are holding steady around 42 days, meaning you have time to be thoughtful rather than frantic.
- South Bend proper shows some price softening, which could mean real opportunity for buyers flexible on location.
- The Granger/46530 area still offers more options than comparable premium markets in larger metros.
✖ Challenges to Keep in Mind
- Inventory is lean across much of St. Joseph County — fewer choices means less negotiating leverage, especially in desirable zip codes.
- The South Bend price softening is neighborhood-specific; don't assume the entire city is a buyer's market without drilling into individual areas.
- The December surge in median price, even if partially statistical, signals that sellers aren't panicking — they're still holding firm on value.
- Interest rates remain elevated nationally, which continues to squeeze affordability even in a modestly priced market like ours.
🏷️ A Word for Sellers in St. Joseph County
If you own a home in St. Joseph County — especially in the 46530 zip code or near the Notre Dame campus — the data suggests you're in a reasonable position. Values have appreciated quietly but consistently. You're not sitting on the kind of gains you'd have seen in 2021-2022, but 2–4% annual appreciation is a long-term wealth-building number that serious investors actually respect.
The key risk for sellers right now is overpricing. With inventory low, it's tempting to push the list price. But buyers in this market are paying attention, and an overpriced listing tends to linger — and a listing that lingers loses leverage fast. Pricing right the first time, especially in a 42-day-average market, is the move.
"The best-selling homes in St. Joseph County right now are the ones priced to attract attention on day one — not homes chasing a number that the market hasn't reached yet."
🔭 What to Watch in 2026
A few factors are worth keeping an eye on as the year unfolds. First, inventory levels: if new listings don't pick up in spring, expect continued upward pressure on prices, particularly in premium areas. Second, interest rates: any meaningful drop in the Fed funds rate could unlock a wave of buyers who've been sitting on the sidelines — that changes the calculus quickly. Third, the South Bend directional shift: a market where prices dip but volume rises is one to revisit in two quarters. It could stabilize into real opportunity, or it could mean the softening is localized and temporary.
For anyone who's been waiting for the "perfect moment" to buy near Notre Dame or in the Granger corridor — spoiler: that moment tends to look obvious only in hindsight. What the data tells us right now is that this market is stable, not stagnant, and patient buyers with a clear strategy are well-positioned.
Ready to Talk Numbers That Actually Apply to You?
Every buyer and seller situation is different. Let's look at your specific neighborhood, price range, and goals — no pressure, no pitch, just real information.
Browse ND-Condos.com Email Tim DirectlyCategories
- All Blogs (88)
- Best Time To Sell (9)
- Condos and Villas (21)
- Elkhart (33)
- For Buyers (56)
- For Sellers (29)
- FSBO (13)
- Granger (31)
- Guides (59)
- Housing Market (35)
- Housing Trends (1)
- Inspections (5)
- Lifestyle (9)
- Market Trends (10)
- Mishawaka (31)
- Mortgage (13)
- Notre Dame (59)
- Property Tax (5)
- South Bend (61)
- Things To Do (3)
- Waterfront (1)
Recent Posts


GET MORE INFORMATION